Cleaning robots support ESG goals by reducing water, energy, and chemical consumption through optimized, data-driven cleaning processes. Their automated operation generates verifiable performance data, enabling transparent and auditable ESG reporting. By taking over repetitive and physically demanding tasks, they improve working conditions and allow staff to focus on higher-value activities. At the same time, standardized processes increase governance quality, compliance, and operational control across facilities.
We believe in BALPEX's vision: together, we are stronger. That's why we support you at every stage of your journey. Whether you are a large BALPEX partner or just getting started, fully robotized or at the very beginning, you're not on your own. We're here to support you every step of the way.
With FieldBots Fleet Management, you have access to all the statistics you need — and can export them with just one click. Learn which insights are available to you at any time, for any selected time period.
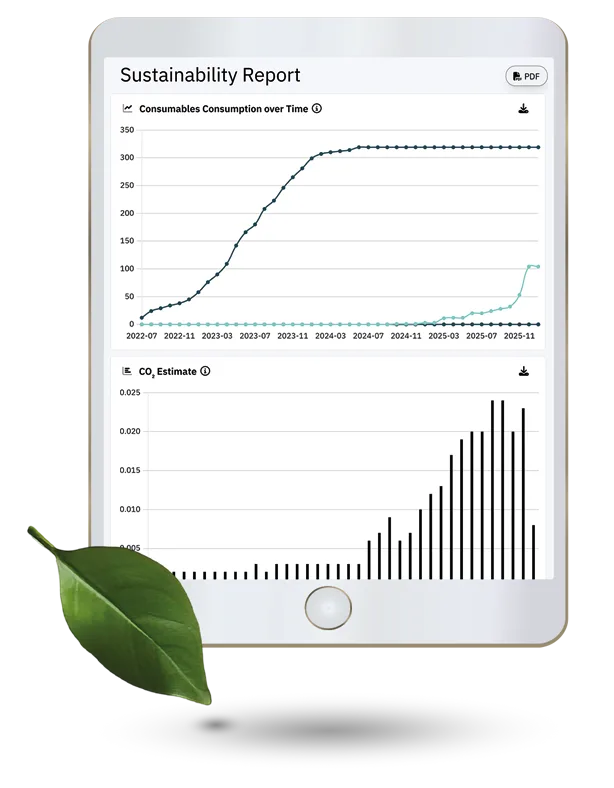
The Consumable Consumption over Time chart shows manually recorded consumable usage per robot model, including items such as main brushes, side brushes, and dustbags. It aggregates replacements over the selected period to visualize wear across the fleet. This helps identify maintenance intensity, detect abnormal usage, and understand cost and wear patterns between different robot models.

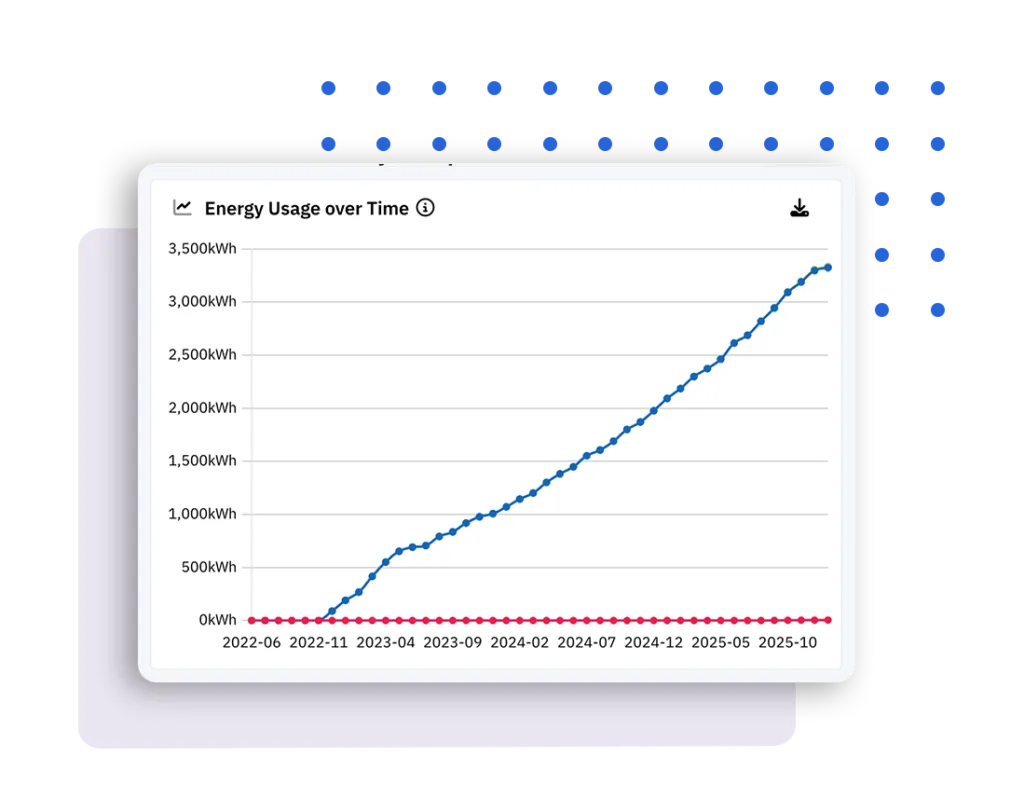
The Energy Usage over Time chart estimates fleet energy consumption in kilowatt-hours based on battery specifications and recorded battery drops per run. Results are aggregated per robot model over the selected period, showing how energy demand evolves over time. This supports comparisons of operational intensity, efficiency, and sustainability across the fleet.
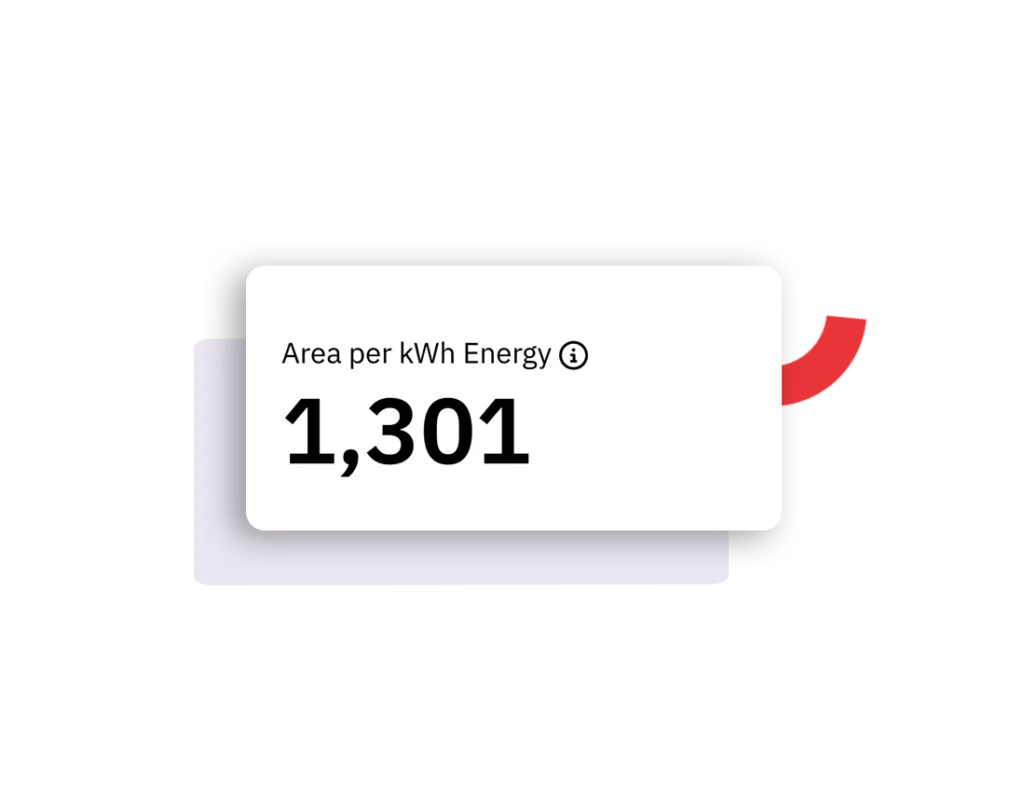
This chart shows how many square meters or square feet can be cleaned on average with one kilowatt-hour of energy, depending on the team's regional settings.
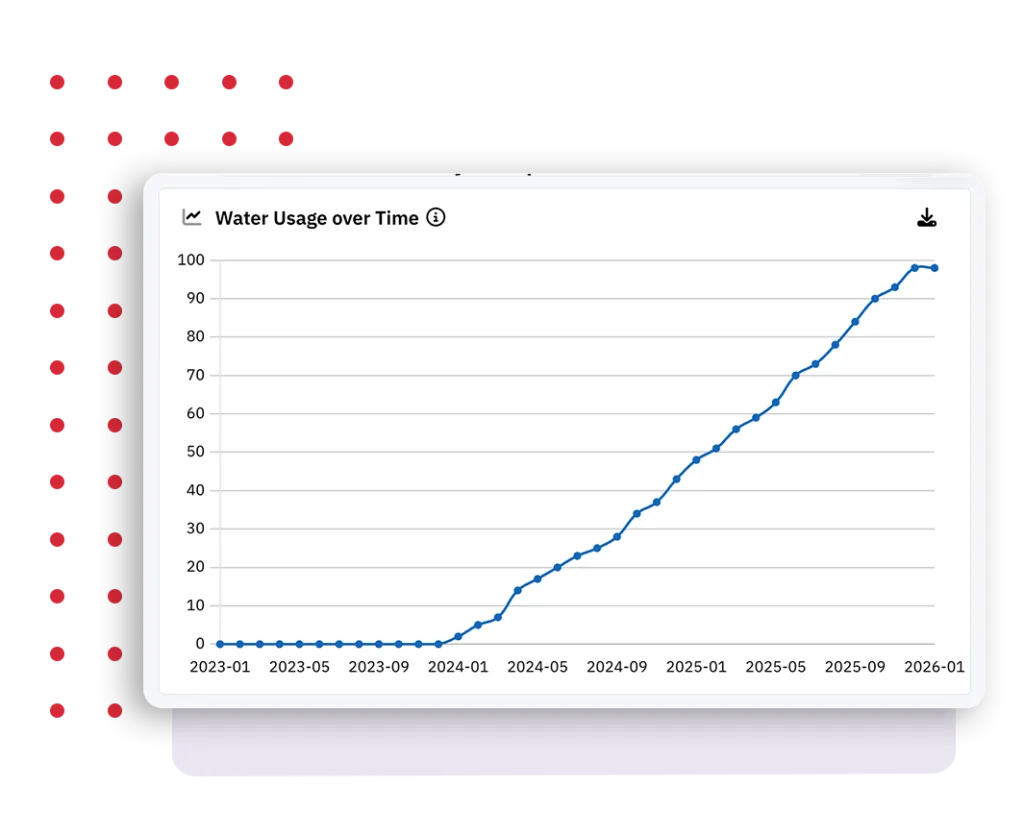
The Water Usage over Time chart aggregates total water consumption from mopping and scrubbing robots across the selected period and sub-fleet. Reported usage per run is summed into a cumulative total and displayed in liters or gallons based on regional settings. This provides a clear view of water consumption trends and overall fleet resource efficiency.
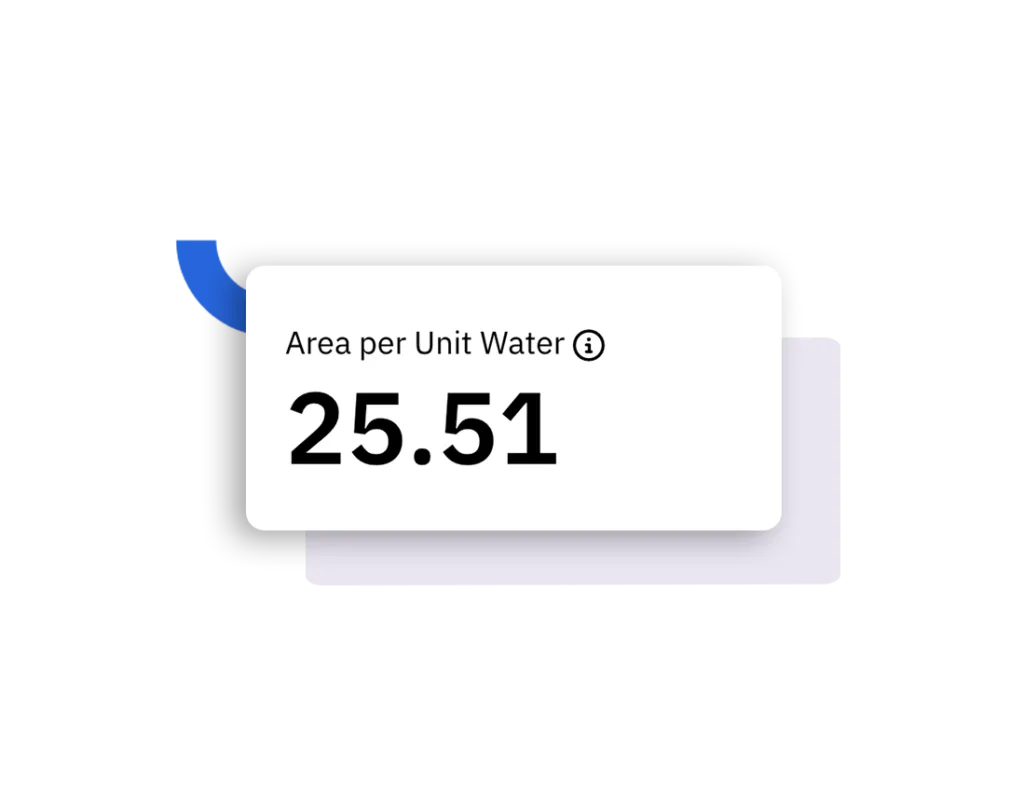
This chart shows how many square meters or square feet can be cleaned on average with one liter of water or one gallon, depending on the team's regional settings.
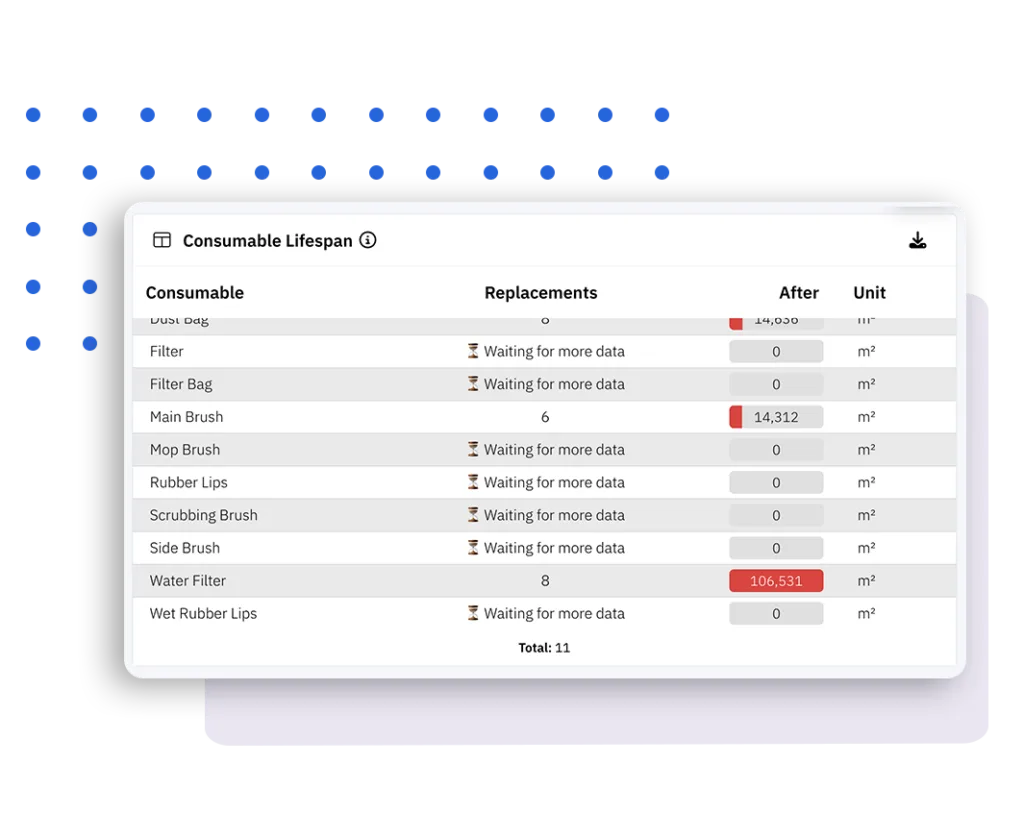
The Consumable Lifespan chart shows the average area cleaned before a consumable is replaced, based on manually reported component replacements. Results are displayed in square meters or square feet, depending on regional settings, and indicate when data is insufficient for a reliable calculation.
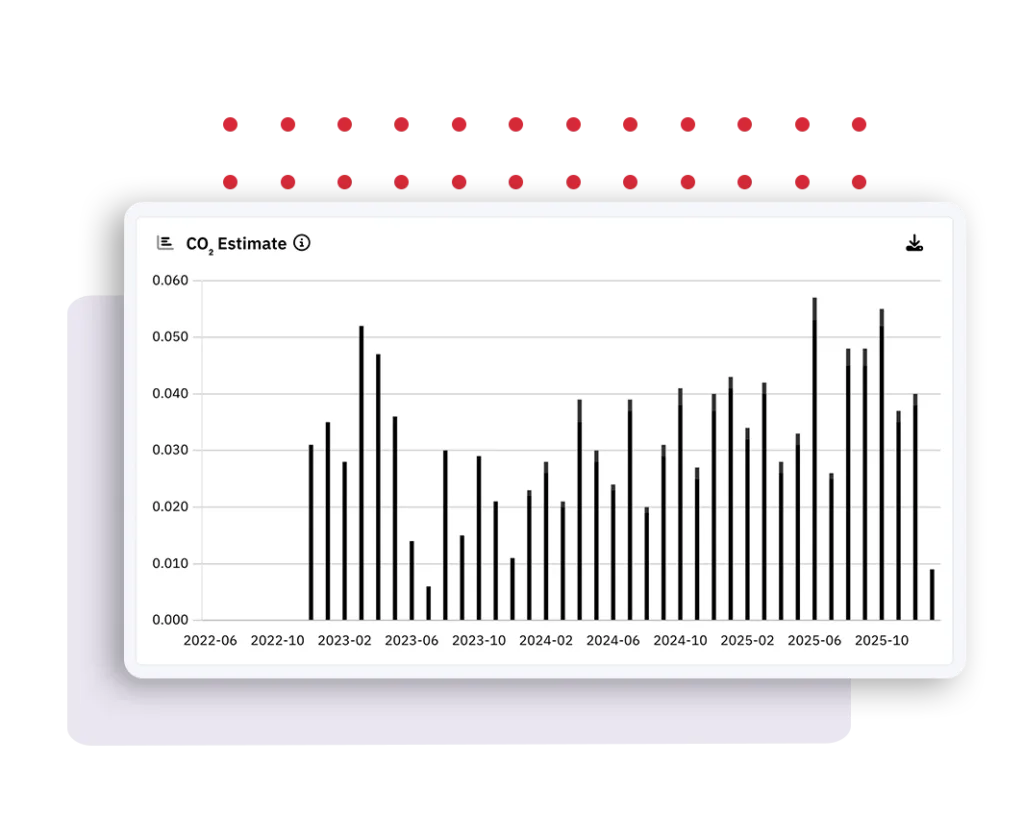
The CO₂ Estimate chart shows an experimental calculation of the fleet's estimated operational carbon emissions over time. It combines energy and water consumption with the national electricity mix and displays aggregated monthly totals in metric or short tons. The calculation covers only emissions from robot operation and excludes manufacturing and transport.
Interested in selling the Cleanfix S170 Navi or Zaco X1000? Get in touch with your dedicated BALPEX partner contact, Andrew.