
What it is
The Sustainability Report turns your robots' operating data into environmental figures: how much energy and water your fleet used, how efficiently it cleaned, which consumables were replaced — and what all of that adds up to in CO₂. In the "Reports" menu the entry reads "Sustainability".
Who uses it
Facility and ESG managers who document sustainability for clients, tenders or internal reporting — and operations teams who want to clean more with less water and energy.
Steps
Open the report
- Open "Reports" in the main navigation and choose "Sustainability".
- Start with the summary card: the headline reads "About {co2} in the period" — for example "About 0.5 t CO₂ in the period" — and the subline below lists "{energy} of energy, {water} of water, {consumables} consumables replaced". The bullet list sums up the period's energy and water efficiency as well as consumable replacements and lifespan.
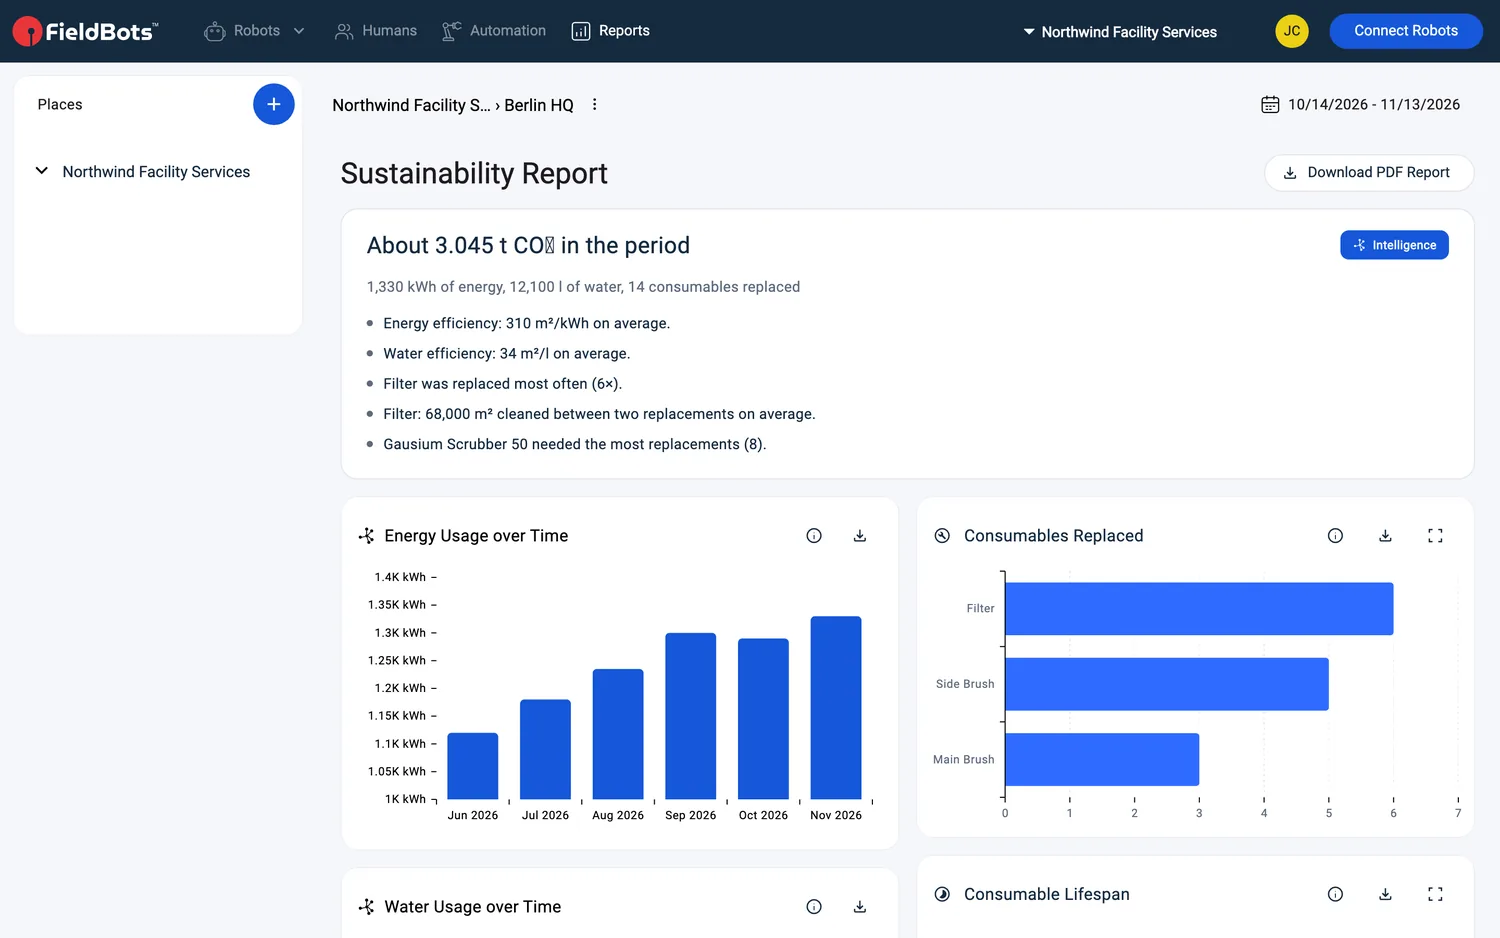
- The page header shows the place the report covers — click it to switch places.
Set the period
- Use the range menu ("Last 30 Days", "Last Month", "This Year", "All Time", "Custom"); it ticks the preset the shown dates match. "Last 30 Days" is the default; your choice is saved for you and your team.
Read the cards
- "Energy Usage over Time" shows kWh per month, estimated from the battery specifications and the battery drop recorded during each run. "Water Usage over Time" shows water consumption per month — in liters or gallons, depending on your team's region.
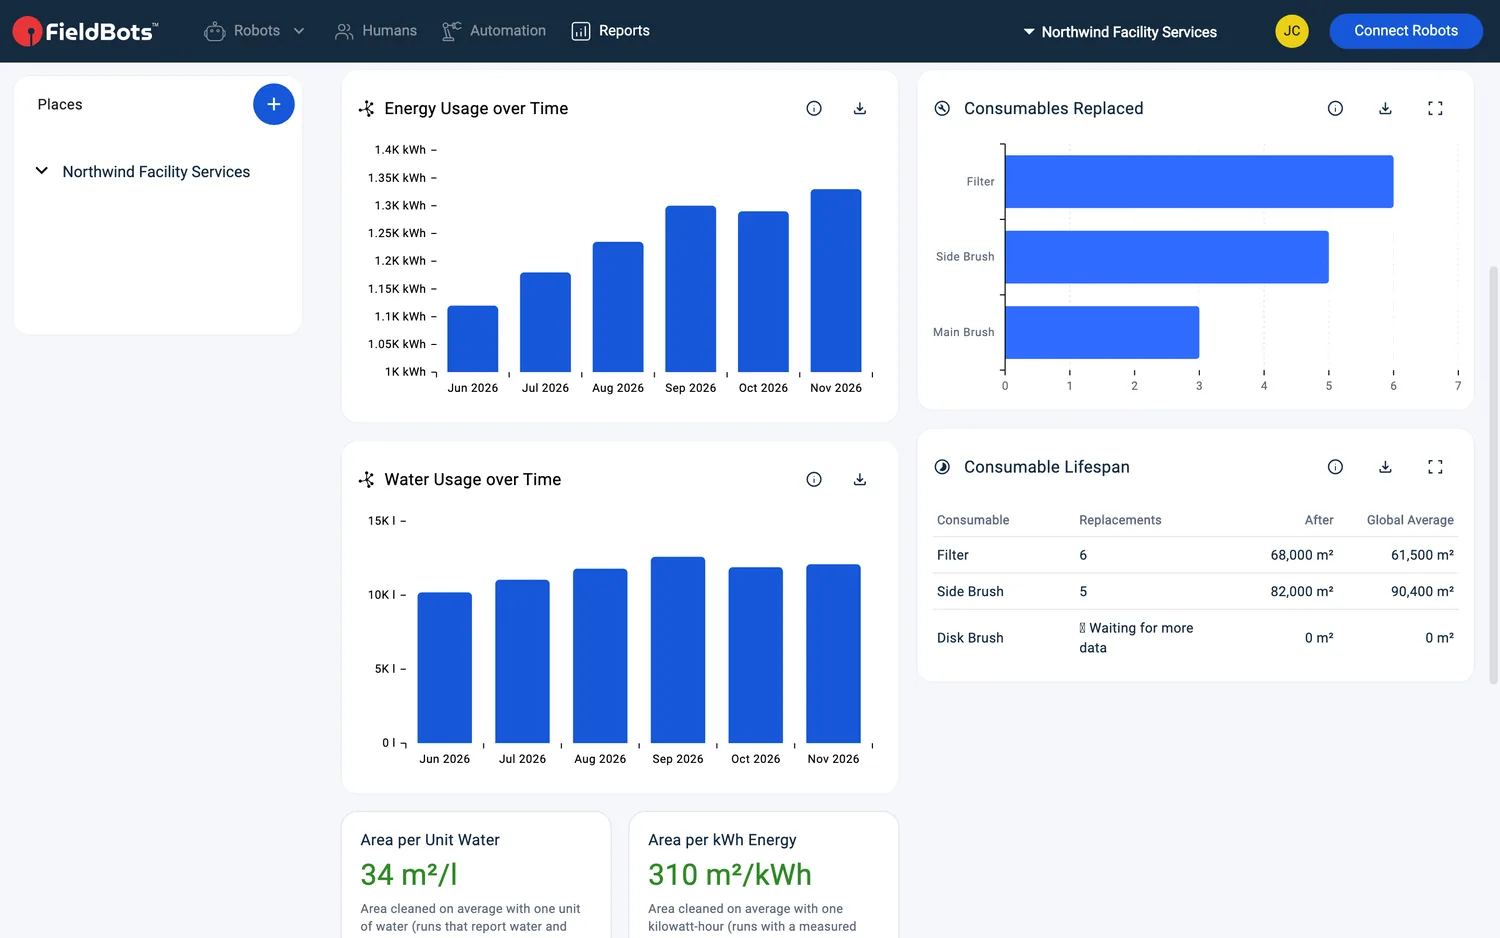
- "Area per Unit Water" and "Area per kWh Energy" show how much area the fleet cleans with one unit of water or one kWh of energy. Both cards carry their caveat: they only count the runs that report the needed data.
- "Consumables Replaced" counts the consumables reported as replaced — main brushes, side brushes, dustbags and similar — most frequent first.
- "Consumable Lifespan" is a table with "Consumable", "Replacements", "After" and "Global Average" columns; a row without enough data yet reads "⏳ Waiting for more data".
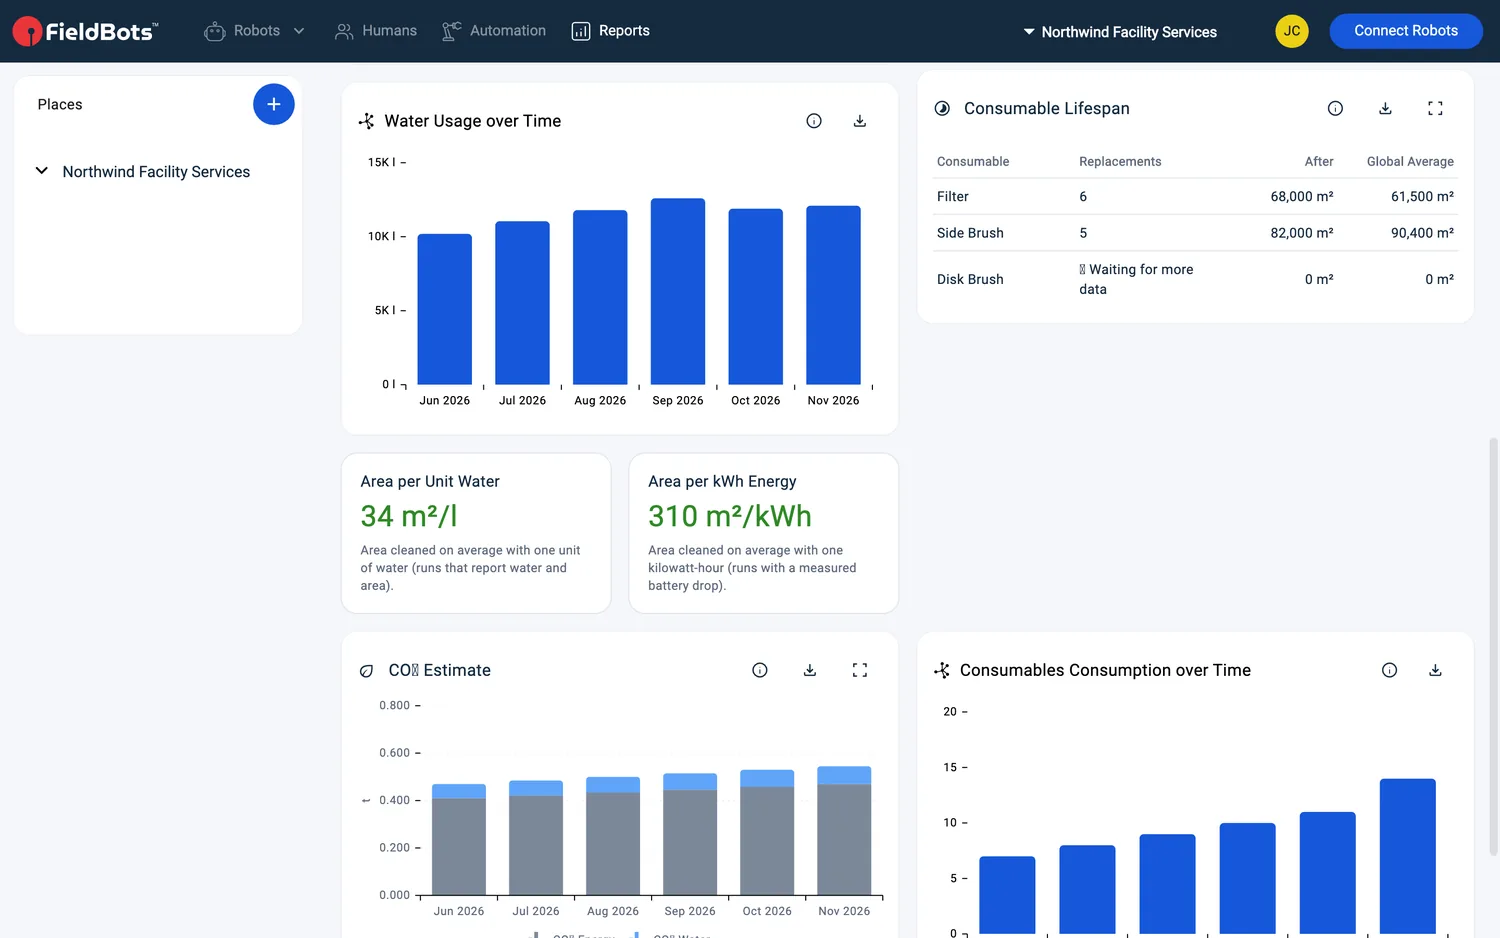
- "CO₂ Estimate" splits the estimate per month into "CO₂ Energy" and "CO₂ Water". It is an experimental estimate based on your energy and water use and your country's energy mix — and it covers robot operation only, not manufacturing or transport.
- "Consumables Consumption over Time" shows replacements per model over time.
Export the report
- "Download CSV" on a card exports that card's numbers.
- "Download PDF Report" captures all cards into one PDF for the period — the task list is not part of it. On phones the button is condensed to "PDF".
Web / Mobile: On wide screens the cards sit in two columns — energy and water on the left, consumables on the right; on phones they stack in one column.
Supported robot models
Available for all connected robots that report energy data; water-consumption figures additionally require the model's water reporting (34 models — most scrubbers and the FieldBots-native microbots).
Notes and limits
- Water and consumable figures are only as complete as the runs that report them. Models that never report water — many sweepers, for example — show empty or zero water series.
- Consumable counts come from replacements that are reported, for example through the "Replaced Consumable" form in the Logbook (see Logbook).
- "⏳ Waiting for more data" rows are normal for a young fleet — an average appears once enough replacements have been recorded.
- The CO₂ figure is an experimental estimate and covers operation only — not manufacturing or transport.
- Water is shown in liters or gallons depending on your team's region; energy is shown in kWh.
- The report follows the place and robot filters set in the "Robots" view.