
What it is
The Utilization Report shows how much work your robots actually deliver — and what that means for your investment. See how many robot days had activity, how your fleet compares with robots of the same models, and how long it takes each model to pay back its purchase price. In the "Reports" menu the entry reads "Utilization".
Who uses it
Operations and fleet managers who steer robot usage, plan the next deployment, or show the value of the fleet to management and clients.
Steps
Open the report
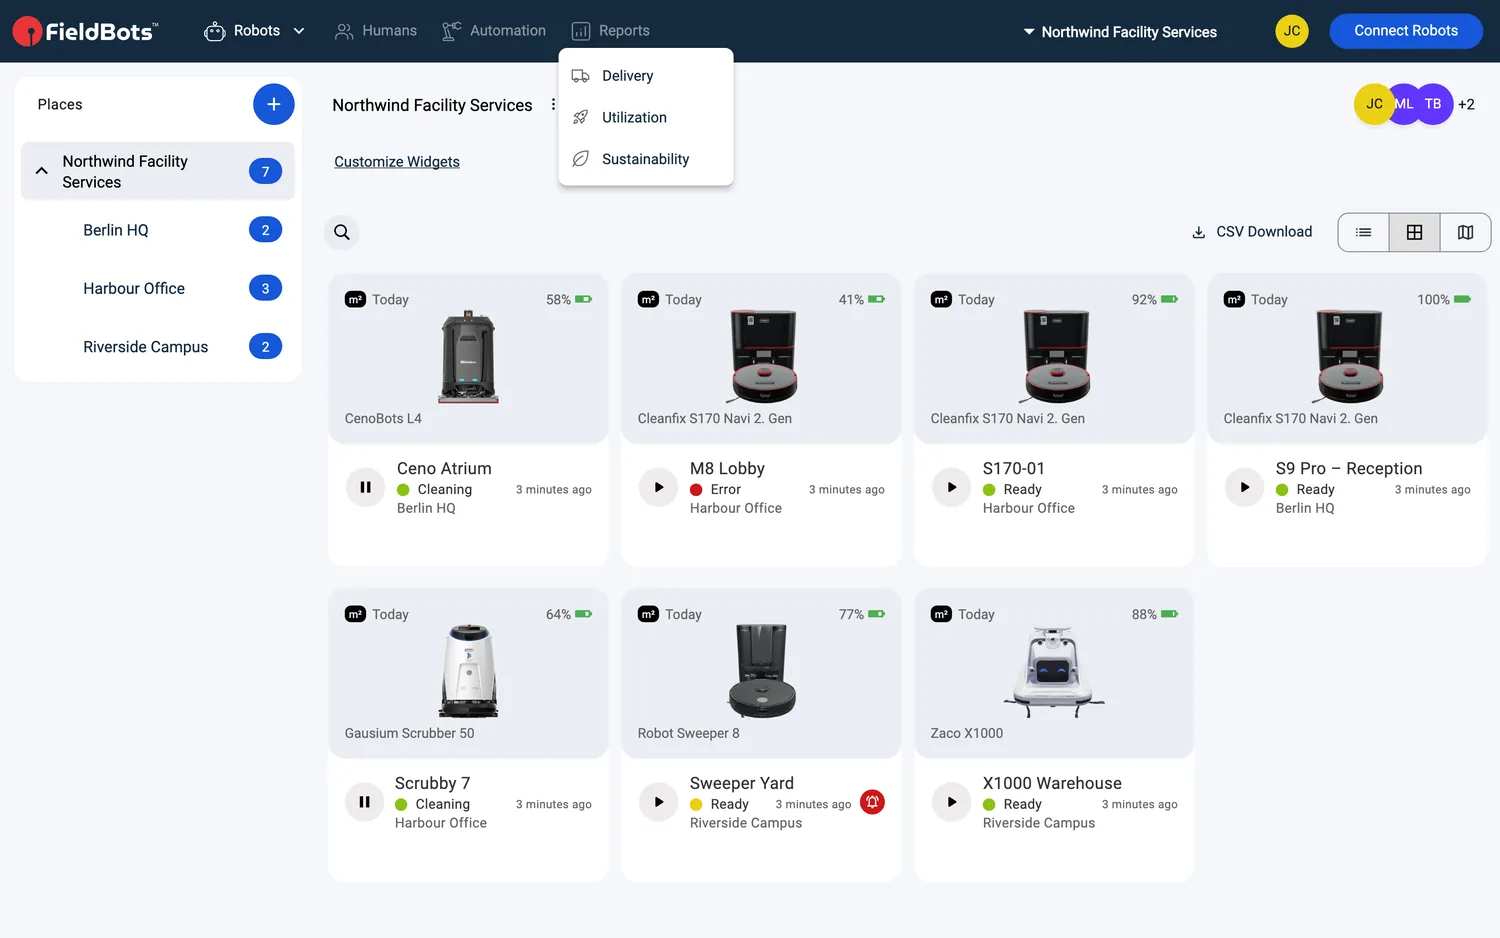
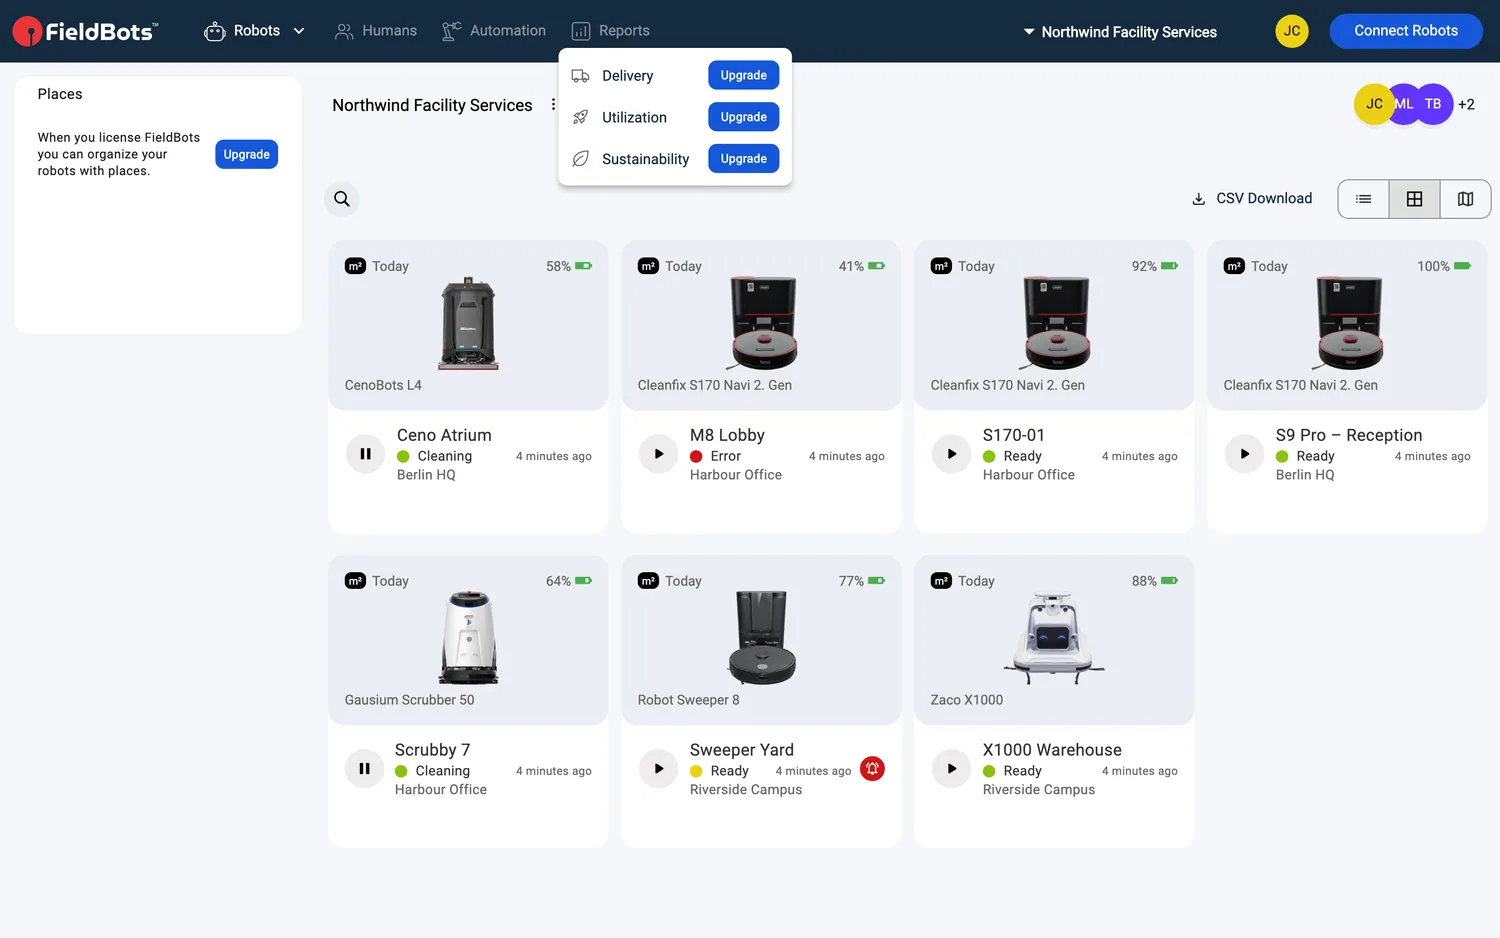
- Open "Reports" in the main navigation and choose "Utilization" — the menu holds the three report entries "Delivery", "Utilization" and "Sustainability", each with its own icon. While the report loads, the page shows a loading skeleton — grey placeholder blocks.
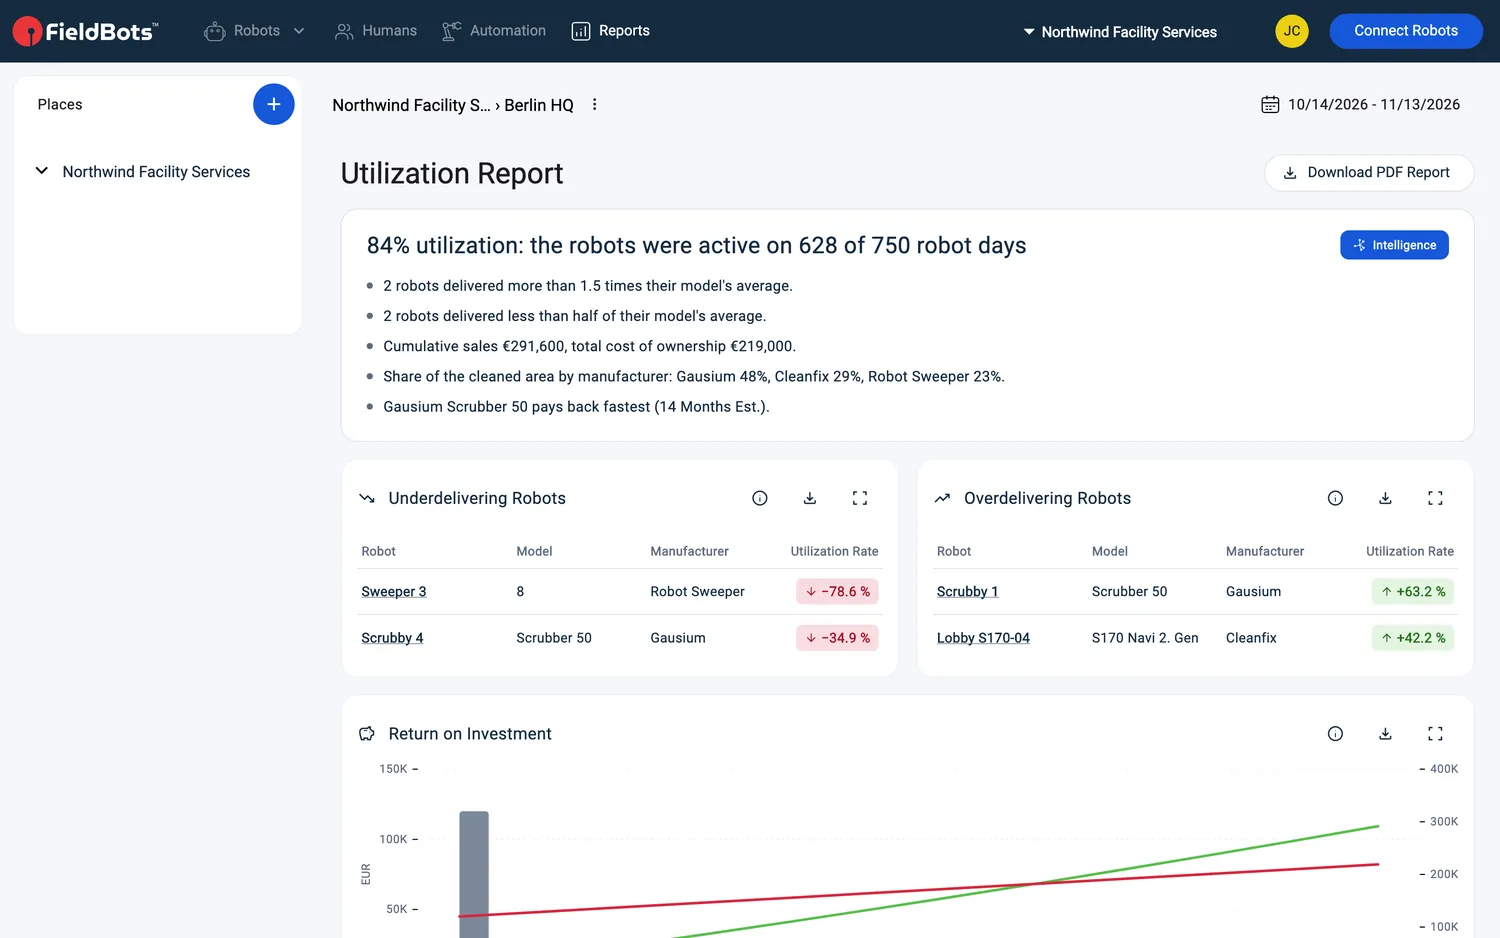
- The page header shows the place the report covers — click it to switch places. The report includes the robots of the selected place, narrowed by any filter you have active in the "Robots" view (for example a manufacturer filter or a search).
- Start with the summary card: the headline names the utilization rate, for example "84% utilization: the robots were active on 628 of 750 robot days". An "Intelligence" tag sits on the summary; the bullet list below sums up what stands out in the period.
Set the period
- Use the range menu — in the top bar on the web, under the page title on phones: "Last 30 Days", "Last Month", "This Year", "All Time" or "Custom". "Custom" opens a calendar to choose your own dates; the menu ticks the preset the shown dates match.
- "Last 30 Days" is the default. Your choice is saved for you and your team and restored the next time you open the report.
Read the cards
- "Underdelivering Robots" and "Overdelivering Robots" compare your robots against the FieldBots average of the same model. A robot appears here when it is at least 50% below or above that average. The tables show "Robot", "Model", "Manufacturer" and "Utilization Rate" — the rate rendered as a +/−% pill against the model's average. If nothing deviates that far, the card reads "No robot deviates that far from its model's average."
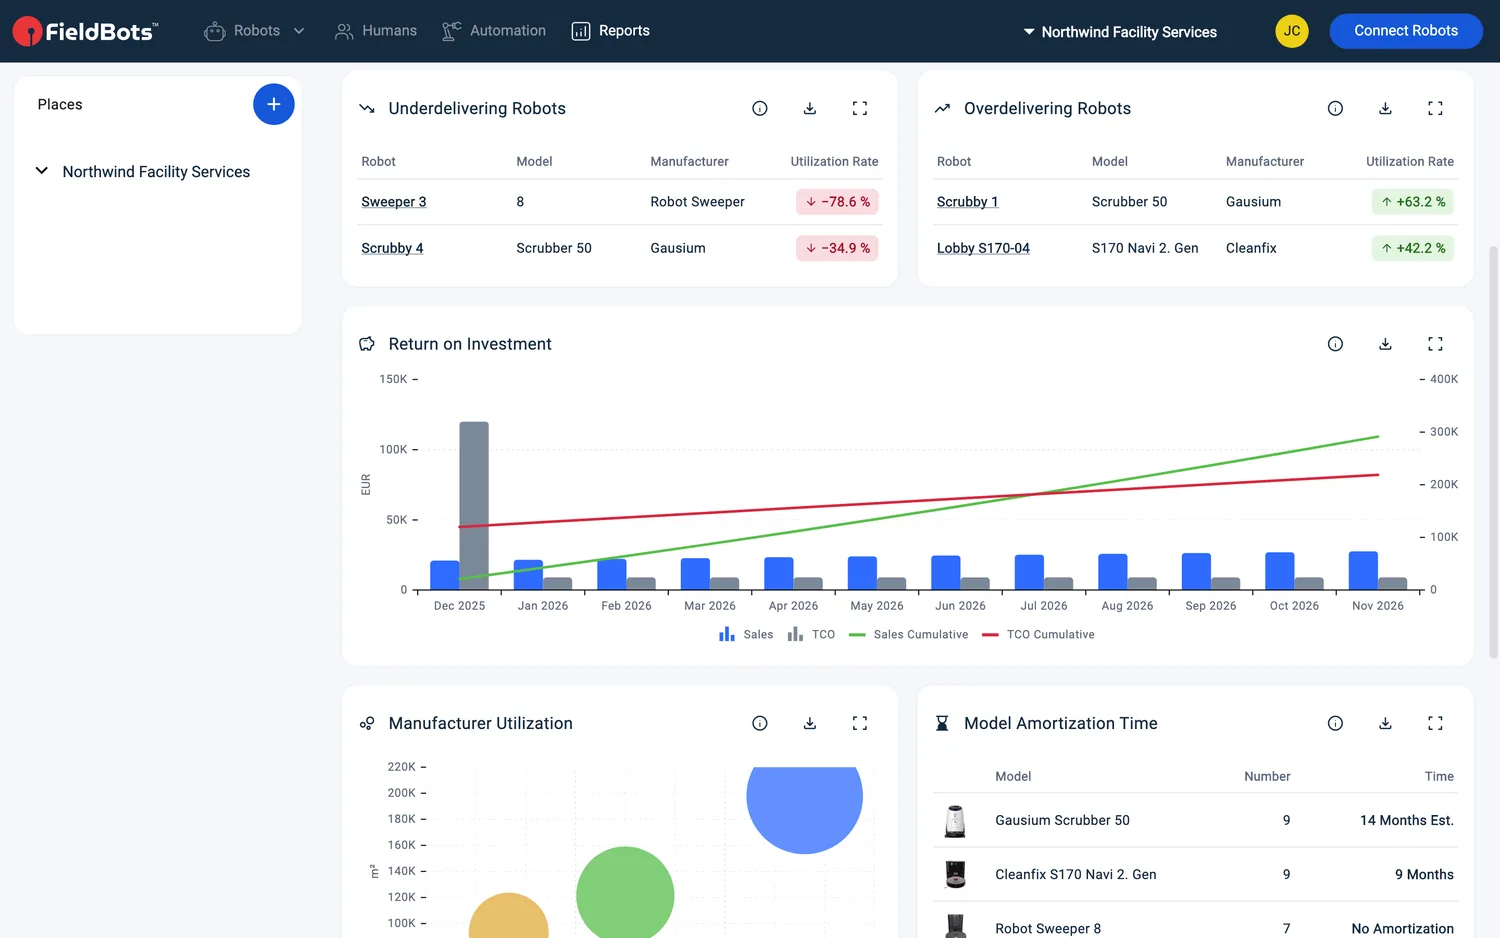
- "Return on Investment" charts "Sales", "TCO" (total cost of ownership), "Sales Cumulative" and "TCO Cumulative" over the period. Revenue is estimated from the unit price per area saved on the robot's place; where no price is maintained, a local-equivalent fallback is used.
- "Manufacturer Utilization" is a bubble chart of operating hours and cleaned area per manufacturer — the circle size shows how many units of that brand you run.
- "Model Amortization Time" shows, per model, the months until the initial investment pays back. "Est." marks projected figures; if a model's costs exceed its revenue, it reads "No Amortization".
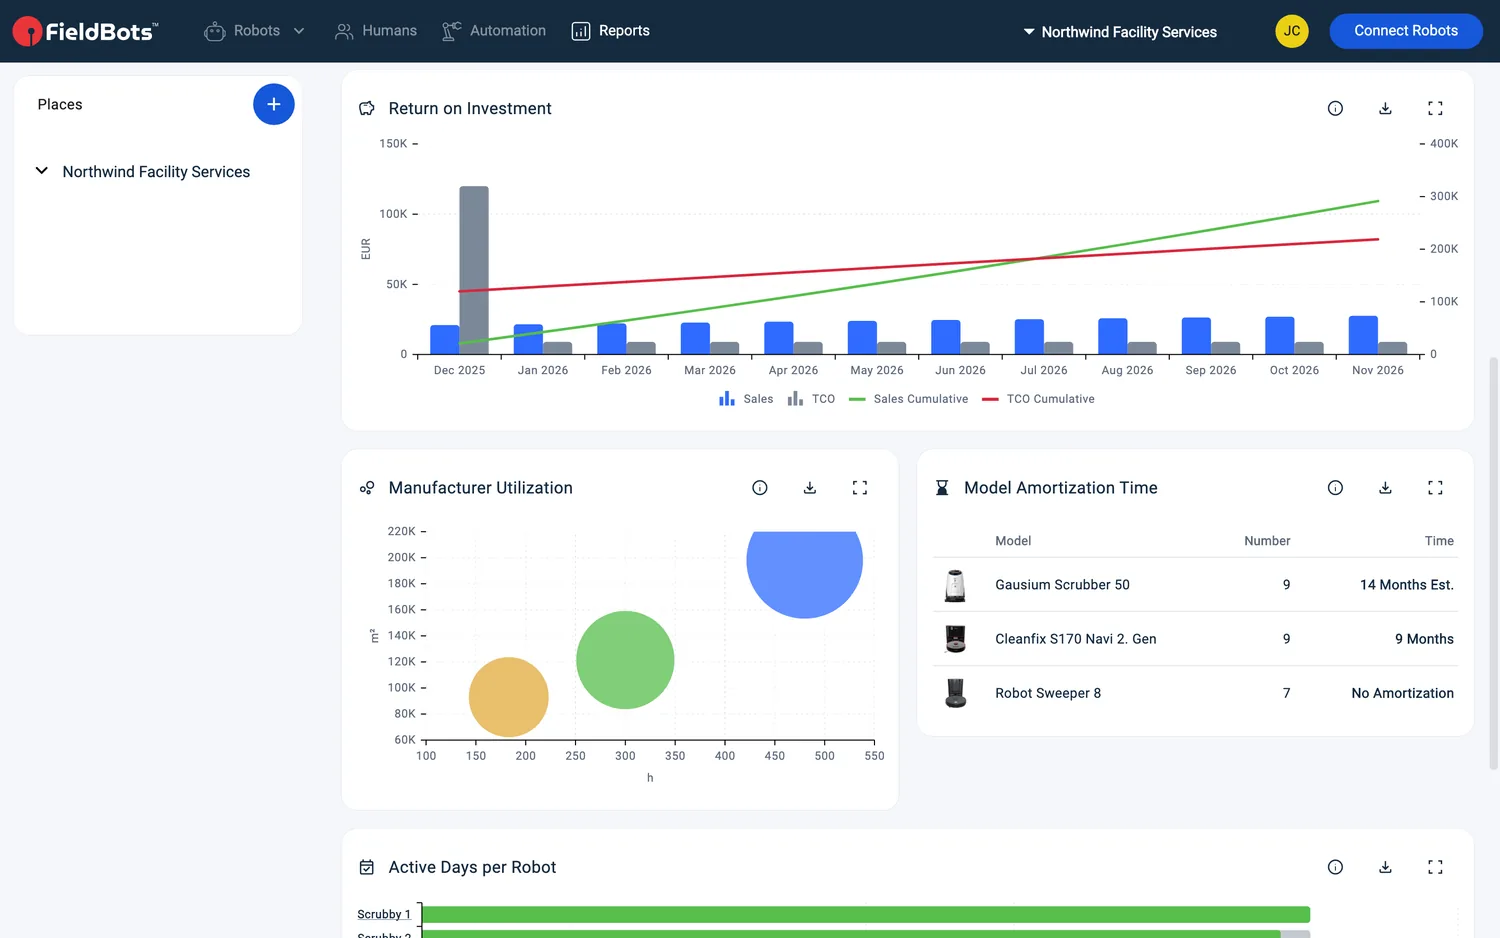
- "Active Days per Robot" charts per-robot bars with "Active Days" against "Days in Period". Every bar and robot name links to that robot's page.
Export the report
- Every card has its own controls: "More Information" explains how the card is calculated, "Download CSV" exports that card's data, and "Expand" / "Collapse" resizes it.
- "Download PDF Report" collects all cards into one PDF for the selected period. On phones the button is condensed to "PDF".
Web / Mobile: On phones the cards stack in one column — from tablet width on they show in two columns — the range menu sits under the page title, and the PDF button reads "PDF".
Supported robot models
Available for all connected robots — utilization, ROI and model benchmarks use the operating data your robots report.
Notes and limits
- The report follows your current place and robot filters — check the place in the header if numbers look unexpected.
- On a Free team, every entry in the "Reports" menu carries an "Upgrade" tag and opening a report returns you to your fleet list.
- Under- and overdelivering compare against robots of the same model across the FieldBots community — a model with few robots in the community may show nothing at first.
- ROI and payback are only as precise as the unit price per area saved on your places; "Est." marks projected figures.
- "Active Days per Robot" charts the 8 busiest robots only.
- "All Time" reaches back about five years — the maximum window the reports can cover.
- If none of your robots reports live data, the page shows "Currently there are no robots in your fleet producing live data." together with "Bring Connected Devices Online".